Introduction to Wave Principle
"The Wave Principle" is Ralph Nelson Elliott's discovery that social, or crowd, behavior trends and reverses in recognizable patterns. Using stock market data as his main research tool, Elliott discovered that the ever-changing path of stock market prices reveals a structural design that in turn reflects a basic harmony found in nature. From this discovery, he developed a rational system of market analysis. Elliott isolated thirteen patterns of movement, or "waves," that recur in market price data and are repetitive in form, but are not necessarily repetitive in time or amplitude. He named, defined and illustrated the patterns. He then described how these structures link together to form larger versions of those same patterns, how they in turn link to form identical patterns of the next larger size, and so on. In a nutshell, then, the Wave Principle is a catalog of price patterns and an explanation of where these forms are likely to occur in the overall path of market development. Elliott's descriptions constitute a set of empirically derived rules and guidelines for interpreting market action. Elliott claimed predictive value for The Wave Principle, which now bears the name, "The Elliott Wave Principle."
Although it is the best forecasting tool in existence, the Wave Principle is not primarily forecasting tool; it is a detailed description of how markets behave. Nevertheless, that description does impart an immense amount of knowledge about the market's position within the behavioral continuum and therefore about its probable ensuing path. The primary value of the Wave Principle is that it provides a context for market analysis. This context provides both a basis for disciplined thinking and a perspective on the market's general position and outlook. At times, its accuracy in identifying, and even anticipating, changes in direction is almost unbelievable. Many areas of mass human activity follow the Wave Principle, but the stock market is where it is most popularly applied. Indeed, the stock market considered alone is far more important than it seems to casual observers. The level of aggregate stock prices is a direct and immediate measure of the popular valuation of man's total productive capability. That this valuation has form is a fact of profound implications that will ultimately revolutionize the social sciences. That, however, is a discussion for another time.
R.N. Elliott's genius consisted of a wonderfully disciplined mental process, suited to studying charts of the Dow Jones Industrial Average and its predecessors with such thoroughness and precision that he could construct a network of principles that covered all market action known to him up to the mid- 1940s. At that time, with the Dow in the 100s, Elliott predicted a great bull market for the next several decades that would exceed all expectations at a time when most investors felt it impossible that the Dow could even better its 1929 peak. As we shall see, phenomenal stock market forecasts, some of pinpoint accuracy years in advance, have accompanied the history of the application of the Elliott Wave approach.
Elliott had theories regarding the origin and meaning of the patterns he discovered, which we will present and expand upon in Lessons 16-19. Until then, suffice it to say that the patterns described in Lessons 1-15 have stood the test of time.
Often one will hear several different interpretations of the market's Elliott Wave status, especially when cursory, off-the-cuff studies of the averages are made by latter day experts.
However, most uncertainties can be avoided by keeping charts on both arithmetic and semilogarithmic scale and by taking care to follow the rules and guidelines as laid down in this course. Welcome to the world of Elliott.
Basic Tenets
Under the Wave Principle, every market decision is both produced by meaningful information and produces meaningful information. Each transaction, while at once an effect, enters the fabric of the market and, by communicating transactional data to investors, joins the chain of causes of others' behavior. This feedback loop is governed by man's social nature, and since he has such a nature, the process generates forms. As the forms are repetitive, they have predictive value.
Sometimes the market appears to reflect outside conditions and events, but at other times it is entirely detached from what most people assume are causal conditions. The reason is that the market has a law of its own. It is not propelled by the linear causality to which one becomes accustomed in the everyday experiences of life. Nor is the market the cyclically rhythmic machine that some declare it to be. Nevertheless, its movement reflects a structured formal progression.
That progression unfolds in waves. Waves are patterns of directional movement. More specifically, a wave is any one of the patterns that naturally occur under the Wave Principle, as described in Lessons 1-9 of this course.
The Five Wave Pattern
In markets, progress ultimately takes the form of five waves of a specific structure. Three of these waves, which are labeled 1, 3 and 5, actually effect the directional movement. They are separated by two countertrend interruptions, which are labeled 2 and 4, as shown in Figure 1-1. The two interruptions are apparently a requisite for overall directional movement to occur.
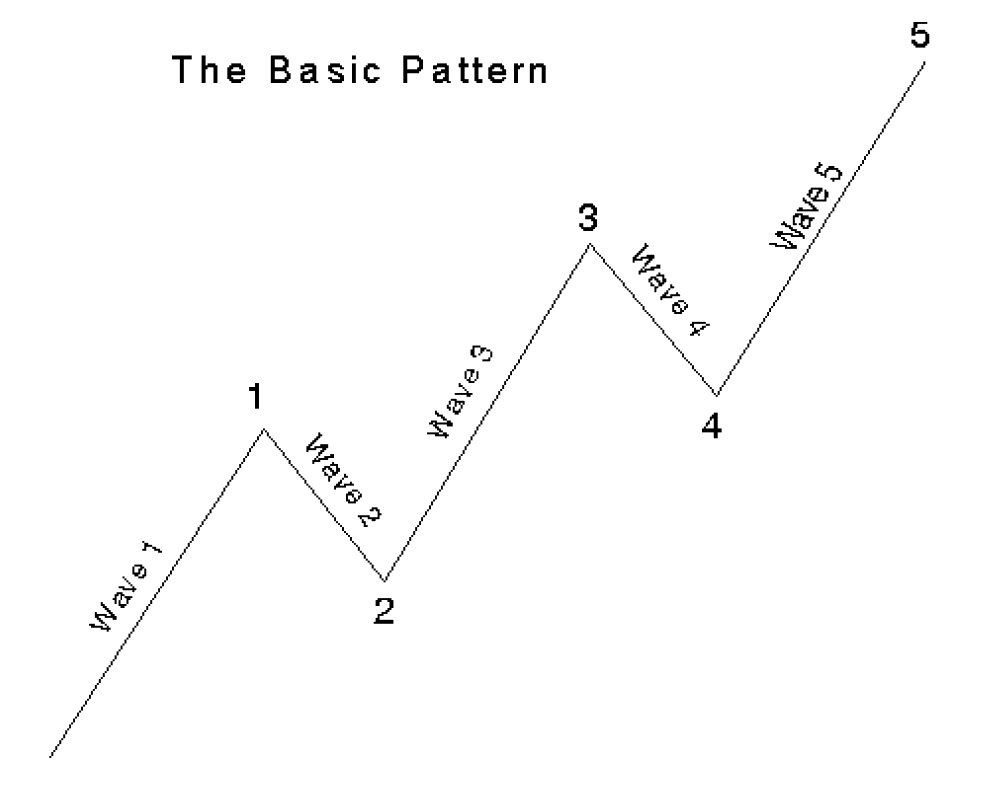
Figure 1-1
R.N. Elliott did not specifically state that there is only one overriding form, the "five wave" pattern, but that is undeniably the case. At any time, the market may be identified as being somewhere in the basic five wave pattern at the largest degree of trend. Because the five wave pattern is the overriding form of market progress, all other patterns are subsumed by it.
Wave Mode
There are two modes of wave development: motive and corrective. Motive waves have a five wave structure, while corrective waves have a three wave structure or a variation thereof. Motive mode is employed by both the five wave pattern of Figure 1-1 and its same-directional components, i.e., waves 1, 3 and 5. Their structures are called "motive" because they powerfully impel the market. Corrective mode is employed by all countertrend interruptions, which include waves 2 and 4 in Figure 1-1. Their structures are called "corrective" because they can accomplish only a partial retracement, or "correction," of the progress achieved by any preceding motive wave. Thus, the two modes are fundamentally different, both in their roles and in their construction, as will be detailed throughout this course.