Tesla (TSLA)
Last updated according to the date and time at the top of the chart.
Elliott Wave Analysis for TSLA
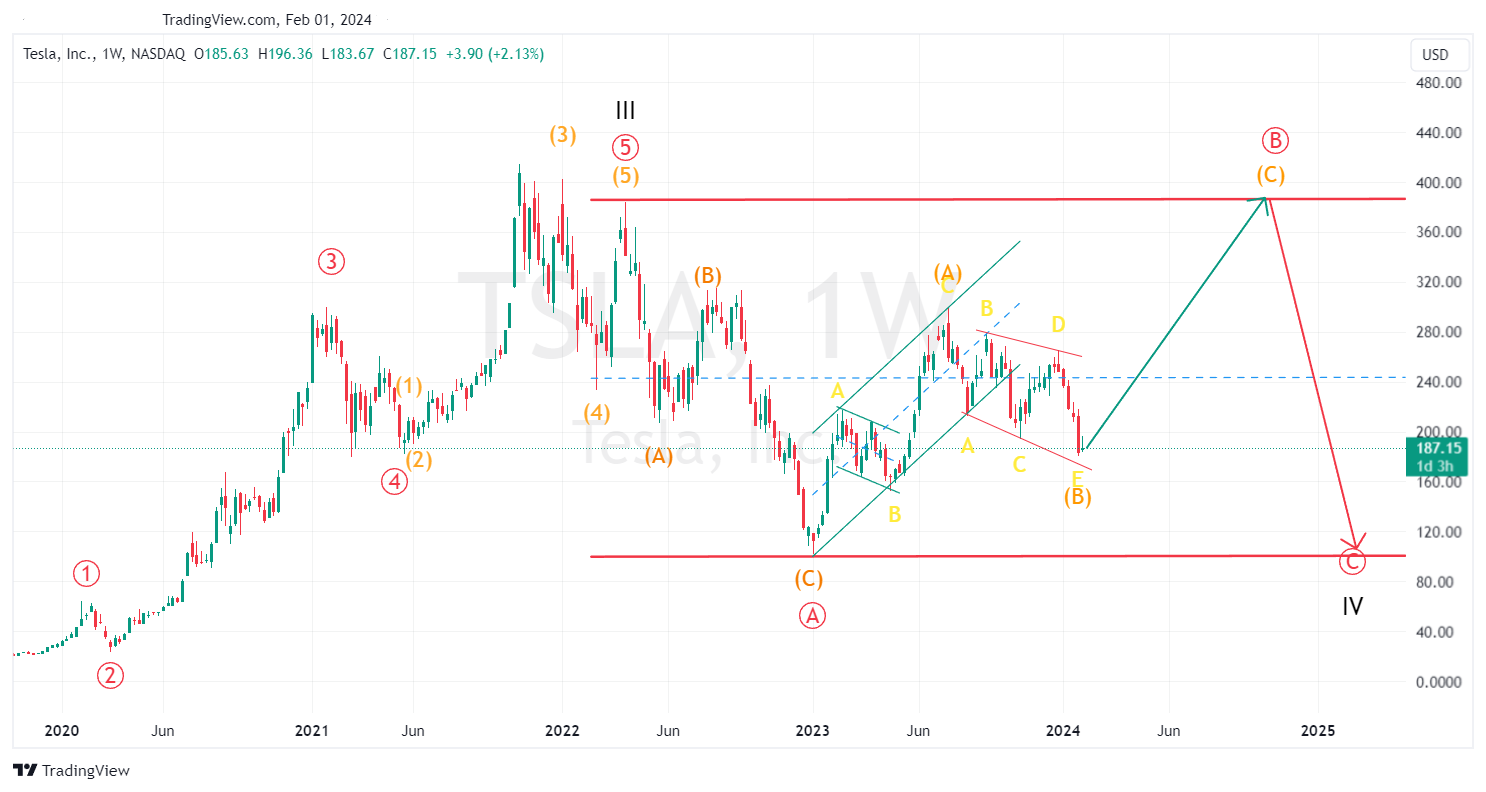
TSLA ended the fifth wave (5) of the fifth wave 5 of the third wave III at 384.29 $ on April 5, 2022. Then, TSLA underwent a zigzag correction (A)(B)(C) to 101.81$ on January 6, 2023. TSLA climbed up in a zigzag correction ABC from 101.81$ on January 6, 2023 to 299.29 $ on Jully 19, 2023 to finish the wave (A) of the correction (A)(B)(C). This was followed by a descending triangle ABCDE to 180.06$ on January 25, 2024, which finished the wave (B) of the correction (A)(B)(C). Based on that, TSLA is predicted to climb up in wave (C) to finish the correction (A)(B)(C). After that, TSLA will move down in an impulsive wave C to finish the flat correction ABC and the fourth wave IV. However, TSLA might not completed the last leg E of the descending triangle ABCDE and it still has to go down to finish this triangle.