Pattern Analysis
The Wave Principle is Ralph Nelson Elliott's discovery that social, or crowd, behavior trends and reverses in recognizable patterns. Using stock market data as his main research tool, Elliott isolated thirteen patterns of movement, or "waves," that recur in market price data. He named, defined and illustrated those patterns. He then described how these structures link together to form larger versions of those same patterns, how those in turn link to form identical patterns of the next larger size, and so on. In a nutshell, then, the Wave Principle is a catalog of price patterns and an explanation of where these forms are likely to occur in the overall path of market development.
The basic pattern Elliott described consists of impulsive waves (denoted by numbers) and corrective waves (denoted by letters). An impulsive wave is composed of five subwaves and moves in the same direction as the trend of the next larger size. A corrective wave is composed of three subwaves and moves against the trend of the next larger size. As Figure 1 shows, these basic patterns link to form five- and three-wave structures of increasingly larger size (larger "degree" in Elliott terminology).
In Figure 1, the first small sequence is an impulsive wave ending at the peak labeled 1. This pattern signals that the movement of one larger degree is also upward. It also signals the start of a three-wave corrective sequence, labeled wave 2.
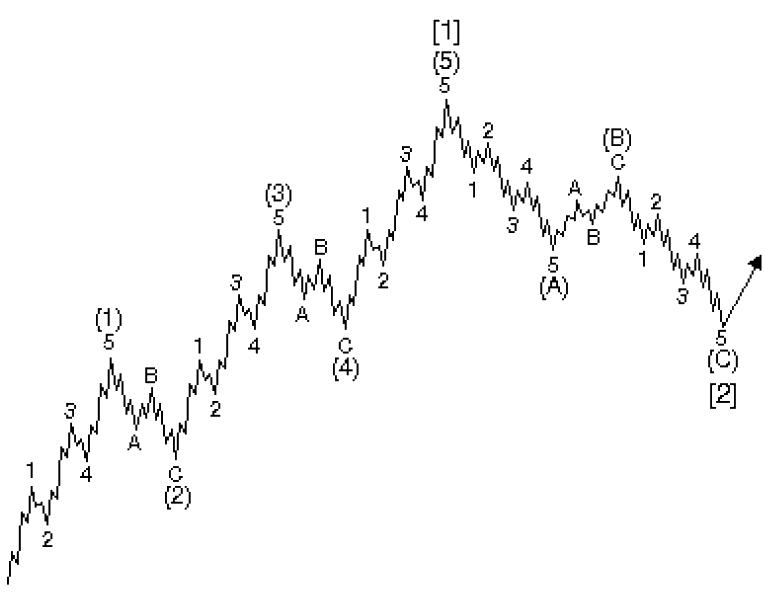
Figure 1
Waves 3, 4 and 5 complete a larger impulsive sequence, labeled wave (1). Exactly as with wave 1, the impulsive structure of wave (1) tells us that the movement at the next larger degree is upward and signals the start of a three-wave corrective downtrend of the same degree as wave (1). This correction, wave (2), is followed by waves (3), (4) and (5) to complete an impulsive sequence of the next larger degree, labeled wave [1]. Once again, a three-wave correction of the same degree occurs, labeled wave [2]. Note that at each "wave one" peak, the implications are the same regardless of the size of the wave. Waves come in degrees, the smaller being the building blocks of the larger. Here are the accepted notations for labeling Elliott Wave patterns at every degree of trend:
| Wave Degree | 5s With the Trend | 3s Against the Trend |
| Grand Supercycle* | [I] [II] [III] [IV] [V] | [A] [B] [C] |
| Supercycle | (I) (II) (III) (IV) (V) | (A) (B) (C) |
| Cycle | I II III IV V | A B C |
| Primary* | [1] [2] [3] [4] [5] | [A] [B] [C] |
| Intermediate | (1) (2) (3) (4) (5) | (A) (B) (C) |
| Minor | 1 2 3 4 5 | A B C |
| Minute* | [i] [ii] [iii] [iv] [v] | [a] [b] [c] |
| Minuette | (i) (ii) (iii) (iv) (v) | [a] [b] [c] |
| Subminuette | i ii iii iv v | a b c |
*degrees normally denoted by circles are here presented with brackets.
Within impulsive waves, one of the odd-numbered waves (usually wave three) is typically longer than the other two. Most impulsive waves unfold between parallel lines except for fifth waves, which occasionally unfold between converging lines in a form called a "diagonal triangle." Variations in corrective patterns involve repetitions of the three-wave theme, creating more complex structures that are named with such terms as "zigzag," "flat," "triangle" and "double three." Waves two and four typically "alternate" in that they take different forms.
Each type of market pattern has a name and a geometry that is specific and exclusive under certain rules and guidelines, yet variable enough in other aspects to allow for a limited diversity within patterns of the same type. If indeed markets are patterned, and if those patterns have a recognizable geometry, then regardless of the variations allowed, certain relationships in extent and duration are likely to recur. In fact, real world experience shows that they do. The most common and therefore reliable wave relationships are discussed in Elliott Wave Principle, by A.J. Frost and Robert Prechter.
Applying the Wave Principle
The practical goal of any analytical method is to identify market lows suitable for buying (or covering shorts), and market highs suitable for selling (or selling short). The Elliott Wave Principle is especially well suited to these functions. Nevertheless, the Wave Principle does not provide certainty about any one market outcome; rather, it provides an objective means of assessing the relative probabilities of possible future paths for the market. At any time, two or more valid wave interpretations are usually acceptable by the rules of the Wave Principle. The rules are highly specific and keep the number of valid alternatives to a minimum. Among the valid alternatives, the analyst will generally regard as preferred the interpretation that satisfies the largest number of guidelines and will accord top alternate status to the interpretation satisfying the next largest number of guidelines, and so on.
Alternate interpretations are extremely important. They are not "bad" or rejected wave interpretations. Rather, they are valid interpretations that are accorded a lower probability than the preferred count. They are an essential aspect of investing with the Wave Principle, because in the event that the market fails to follow the preferred scenario, the top alternate count becomes the investor's backup plan.
Fibonacci Relationships
One of Elliott's most significant discoveries is that because markets unfold in sequences of five and three waves, the number of waves that exist in the stock market's patterns reflects the Fibonacci sequence of numbers (1, 1, 2, 3, 5, 8, 13, 21, 34, etc.), an additive sequence that nature employs in many processes of growth and decay, expansion and contraction, progress and regress. Because this sequence is governed by the ratio, it appears throughout the price and time structure of the stock market, apparently governing its progress.
What the Wave Principle says, then, is that mankind's progress (of which the stock market is a popularly determined valuation) does not occur in a straight line, does not occur randomly, and does not occur cyclically. Rather, progress takes place in a "three steps forward, two steps back" fashion, a form that nature prefers. As a corollary, the Wave Principle reveals that periods of setback in fact are a requisite for social (and perhaps even individual) progress.
Implications
A long term forecast for the stock market provides insight into the potential changes in social psychology and even the occurrence of resulting events. Since the Wave Principle reflects social mood change, it has not been surprising to discover, with preliminary data, that the trends of popular culture that also reflect mood change move in concert with the ebb and flow of aggregate stock prices. Popular tastes in entertainment, self-expression and political representation all reflect changing social moods and appear to be in harmony with the trends revealed more precisely by stock market data. At one-sided extremes of mood expression, changes in cultural trends can be anticipated.
On a philosophical level, the Wave Principle suggests that the nature of mankind has within it the seeds of social change. As an example simply stated, prosperity ultimately breeds reactionism, while adversity eventually breeds a desire to achieve and succeed. The social mood is always in flux at all degrees of trend, moving toward one of two polar opposites in every conceivable area, from a preference for heroic symbols to a preference for anti-heroes, from joy and love of life to cynicism, from a desire to build and produce to a desire to destroy. Most important to individuals, portfolio managers and investment corporations is that the Wave Principle indicates in advance the relative magnitude of the next period of social progress or regress.
Living in harmony with those trends can make the difference between success and failure in financial affairs. As the Easterners say, "Follow the Way." As the Westerners say, "Don't fight the tape." In order to heed these nuggets of advice, however, it is necessary to know what is the Way, and which way the tape. There is no better method for answering that question than the Wave Principle.
Glossary
Alternation (guideline of) - If wave two is a sharp correction, wave four will usually be a sideways correction, and vice versa.
Apex - Intersection of the two boundary lines of a contracting triangle.
Corrective wave - A three wave pattern, or combination of three wave patterns, that moves in the opposite direction of the trend of one larger degree.
Diagonal Triangle (Ending) - A wedge shaped pattern containing overlap that occurs only in fifth or C waves. Subdivides 3-3-3-3-3.
Diagonal Triangle (Leading) - A wedge shaped pattern containing overlap that occurs only in first or A waves. Subdivides 5-3-5-3-5.
Double Three - Combination of two simple sideways corrective patterns, labeled W and Y, separated by a corrective wave labeled X.
Double Zigzag - Combination of two zigzags, labeled W and Y, separated by a corrective wave labeled X.
Equality (guideline of) - In a five-wave sequence, when wave three is the longest, waves five and one tend to be equal in price length.
Expanded Flat - Flat correction in which wave B enters new price territory relative to the preceding impulse wave.
Failure - See Truncated Fifth.
Flat - Sideways correction labeled A-B-C. Subdivides 3-3-5.
Impulse Wave - A five wave pattern that subdivides 5-3-5-3-5 and contains no overlap.
Impulsive Wave - A five wave pattern that makes progress, i.e., any impulse or diagonal triangle.
Irregular Flat - See Expanded Flat.
One-two, one-two - The initial development in a five wave pattern, just prior to acceleration at the center of wave three.
Overlap - The entrance by wave four into the price territory of wave one. Not permitted in impulse waves.
Previous Fourth Wave - The fourth wave within the preceding impulse wave of the same degree. Corrective patterns typically terminate in this area.
Sharp Correction - Any corrective pattern that does not contain a price extreme meeting or exceeding that of the ending level of the prior impulse wave; alternates with sideways correction.
Sideways Correction - Any corrective pattern that contains a price extreme meeting or exceeding that of the prior impulse wave; alternates with sharp correction.
Third of a Third - Powerful middle section within an impulse wave.
Thrust - Impulsive wave following completion of a triangle.
Triangle (contracting, ascending or descending) - Corrective pattern, subdividing 3-3-3-3-3 and labeled a-b-c-d-e. Occurs as a fourth, B, X (in sharp correction only) or Y wave. Trendlines converge as pattern progresses.
Triangle (expanding) - Same as other triangles but trendlines diverge as pattern progresses.
Triple Three - Combination of three simple sideways corrective patterns labeled W, Y and Z, each separated by a corrective wave labeled X.
Triple Zigzag - Combination of three zigzags, labeled W, Y and Z, each separated by a corrective wave labeled X.
Truncated Fifth - The fifth wave in an impulsive pattern that fails to exceed the price extreme of the third wave.
Zigzag - Sharp correction, labeled A-B-C. Subdivides 5-3-5.