Motive and Corrective Wave Multiples
Motive Wave Multiples
Lesson 12 mentioned that when wave 3 is extended, waves 1 and 5 tend towards equality or a .618 relationship, as illustrated in Figure 4-3. Actually, all three motive waves tend to be related by Fibonacci mathematics, whether by equality, 1.618 or 2.618 (whose inverses are .618 and .382). These impulse wave relationships usually occur in percentage terms. For instance, wave I from 1932 to 1937 gained 371.6%, while wave III from 1942 to 1966 gained 971.7%, or 2.618 times as much. Semilog scale is required to reveal these relationships. Of course, at small degrees, arithmetic and percentage scales produce essentially the same result, so that the number of points in each impulse wave reveals the same multiples.
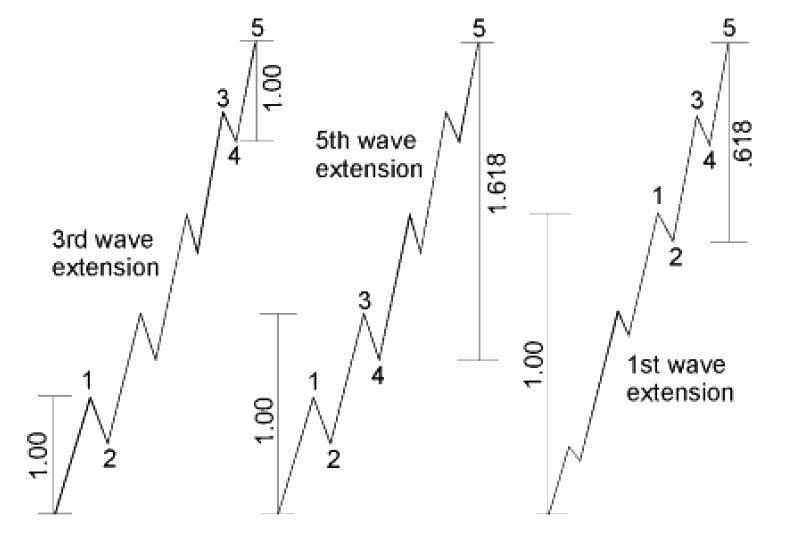
Figure 4-3, Figure 4-4 and Figure 4-5
Another typical development is that wave 5's length is sometimes related by the Fibonacci ratio to the length of wave 1 through wave 3, as illustrated in Figure 4-4, which illustrates the point with an extended fifth wave. .382 and .618 relationships occur when wave five is not extended. In those rare cases when wave 1 is extended, it is wave 2, quite reasonably, that often subdivides the entire impulse wave into the Golden Section, as shown in Figure 4-5.
As a generalization that subsumes some of the observations we have already made, unless wave 1 is extended, wave 4 often divides the price range of an impulse wave into the Golden Section. In such cases, the latter portion is .382 of the total distance when wave 5 is not extended, as shown in Figure 4-6, and .618 when it is, as shown in Figure 4-7. This guideline is somewhat loose in that the exact point within wave 4 that effects the subdivision varies. It can be its start, end or extreme counter-trend point. Thus, it provides, depending on the circumstances, two or three closely-clustered targets for the end of wave 5. This guideline explains why the target for a retracement following a fifth wave often is doubly indicated by the end of the preceding fourth wave and the .382 retracement point.
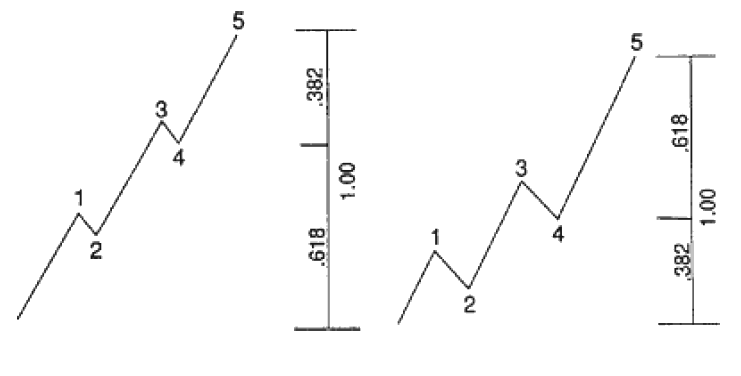
Figure 4-6 and Figure 4-7
Corrective Wave Multiples
In a zigzag, the length of wave C is usually equal to that of wave A, as shown in Figure 4-8, although it is not uncommonly 1.618 or .618 times the length of wave A. This same relationship applies to a second zigzag relative to the first in a double zigzag pattern, as shown in Figure 4-9.
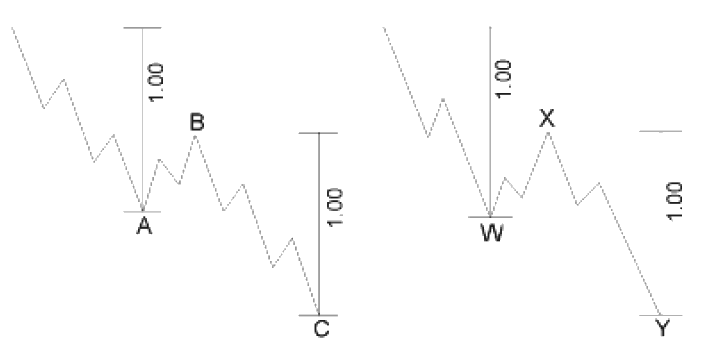
Figure 4-8 and Figure 4-9
In a regular flat correction, waves A, B and C are, of course, approximately equal, as shown in Figure 4-10. In an expanded flat correction, wave C is often 1.618 times the length of wave A. Sometimes wave C will terminate beyond the end of wave A by .618 times the length of wave A. Both of these tendencies are illustrated in Figure 4-11. In rare cases, wave C is 2.618 times the length of wave A. Wave B in an expanded flat is sometimes 1.236 or 1.382 times the length of wave A.
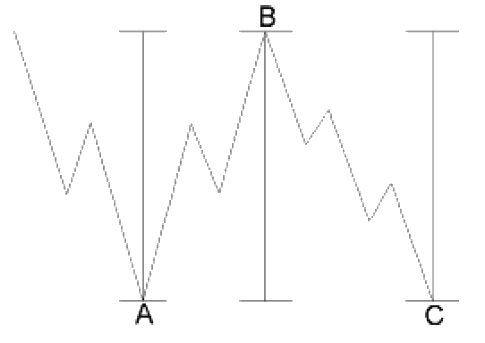
Figure 4-10
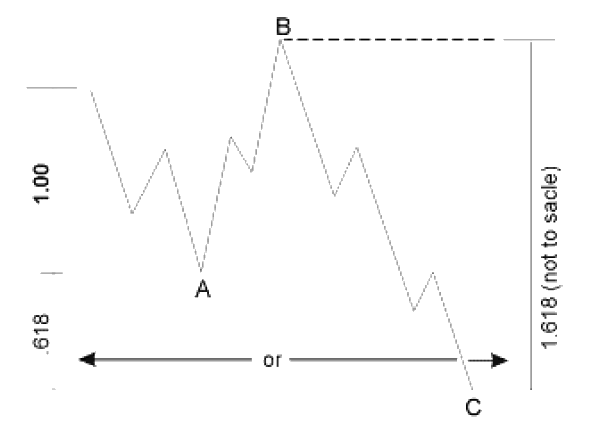
Figure 4-11
In a triangle, we have found that at least two of the alternate waves are typically related to each other by .618. I.e., in a contracting, ascending or descending triangle, wave e = .618c, wave c = .618a, or wave d = .618b. In an expanding triangle, the multiple is 1.618. In rare cases, adjacent waves are related by these ratios.
In double and triple corrections, the net travel of one simple pattern is sometimes related to another by equality or, particularly if one of the threes is a triangle, by .618.
Finally, wave 4 quite commonly spans a gross and/or net price range that has an equality or Fibonacci relationship to its corresponding wave 2. As with impulse waves, these relationships usually occur in percentage terms.