Applied Ratio Analysis
Elliott himself, a few years after Rhea's book, was the first to realize the applicability of ratio analysis. He noted that the number of DJIA points between 1921 and 1926, encompassing the first through third waves, was 61.8% of the number of points in the fifth wave from 1926 to 1928 (1928 is the orthodox top of the bull market according to Elliott). Exactly the same relationship occurred again in the five waves up from 1932 to 1937.
A. Hamilton Bolton, in the 1957 Elliott Wave Supplement to the Bank Credit Analyst, gave this price forecast based on expectations of typical wave behavior:
The powerhouse that will be building up if the market consolidates for another year or so along orthodox lines, it seems to us, will offer the probability that Primary V could be quite sensational, taking the DJIA to 1000 or more in the early 1960s in a wave of great speculation.
Then, in The Elliott Wave Principle — A Critical Appraisal, reflecting on examples cited by Elliott, Bolton stated,
Should the 1949 market to date adhere to this formula, then the advance from 1949 to 1956 (361 points in the DJIA) should be completed when 583 points (161.8% of 361 points) have been added to the 1957 low of 416, or a total of 999 DJIA. Alternatively, 361 over 416 would call for 777 in the DJIA.
Later, when Bolton wrote the 1964 Elliott Wave Supplement, he concluded,
Since we are now well past the 777 level, it looks as if 1000 in the averages could be our next target.
The year 1966 proved those statements to be the most accurate prediction in stock market history, when the 3:00 p.m. hourly reading on February 9th registered a high at 995.82 (the "intraday" high was 1001.11). Six years prior to the event, then, Bolton was right to within 3.18 DJIA points, less than one third of one percent error.
Despite this remarkable portent, it was Bolton's view, as it is ours, that wave form analysis must take precedence over the implications of the proportionate relationships of waves in a sequence. Indeed, when undertaking a ratio analysis, it is essential that one understand and apply the Elliott counting and labeling methods to determine from which points the measurements should be made in the first place. Ratios between lengths based on orthodox pattern termination levels are reliable; those based on nonorthodox price extremes generally are not.
The authors themselves have used ratio analysis, often with satisfying success. A.J. Frost became convinced of his ability to recognize turning points by catching the "Cuban crisis" low in October 1962 the hour it occurred and telegraphing his conclusion to Hamilton Bolton in Greece. Then, in 1970, in a supplement to The Bank Credit Analyst, he determined that the bear market low for the Cycle wave correction in progress would probably occur at a level .618 times the distance of the 1966-67 decline below the 1967 low, or 572. Four years later, the DJIA's hourly reading in December 1974 at the exact low was 572.20, from which the explosive rise into 1975-76 occurred.
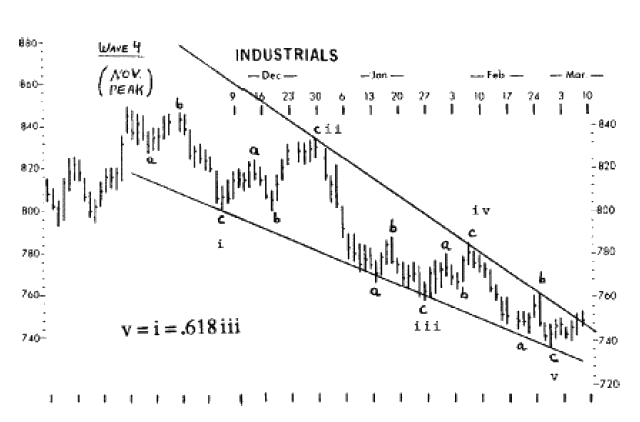
Ratio analysis has value at smaller degrees as well. In the summer of 1976, in a published report for Merrill Lynch, Robert Prechter identified the fourth wave then in progress as a rare expanding triangle, and in October used the 1.618 ratio to determine the maximum expected low for the eight month pattern to be 922 on the Dow. The low occurred five weeks later at 920.63 at 11:00 on November 11, launching the year-end fifth wave rally.
In October 1977, five months in advance, Mr. Prechter computed a probable level for the 1978 major bottom as "744 or slightly lower." On March 1, 1978, at 11:00, the Dow registered its low at exactly 740.30. A follow-up report published two weeks after the bottom reaffirmed the importance of the 740 level, noting that:
...the 740 area marks the point at which the 1977-78 correction, in terms of Dow points, is exactly .618 times the length of the entire bull market rise from 1974 to 1976. Mathematically we can state that 1022 - (1022-572).618 = 744 (or using the orthodox high on December 31st, 1005 - (1005-572).618 = 737). Second, the 740 area marks the point at which the 1977-78 correction is exactly 2.618 times the length of the preceding correction in 1975 from July to October, so that 1005 - (885-784)2.618 = 742. Third, in relating the target to the internal components of the decline, we find that the length of wave C = 2.618 times the length of wave A if wave C bottoms at 746. Even the wave factors as researched in the April 1977 report mark 740 as a likely level for a turn. At this juncture then, the wave count is compelling, the market appears to be stabilizing, and the last acceptable Fibonacci target level under the Cycle dimension bull market thesis has been reached at 740.30 on March 1st. It is at such times that the market, in Elliott terms, must "make it or break it."
The three charts from that report are reproduced here as Figures 4-12 (with a few extra markings to condense comments from the text), 4-13 and 4-14. They illustrate the wave structure into the recent low from Primary down to Minuette degree. Even at this early date, 740.30 seems to be firmly established as the low of Primary wave [2] in Cycle wave V.
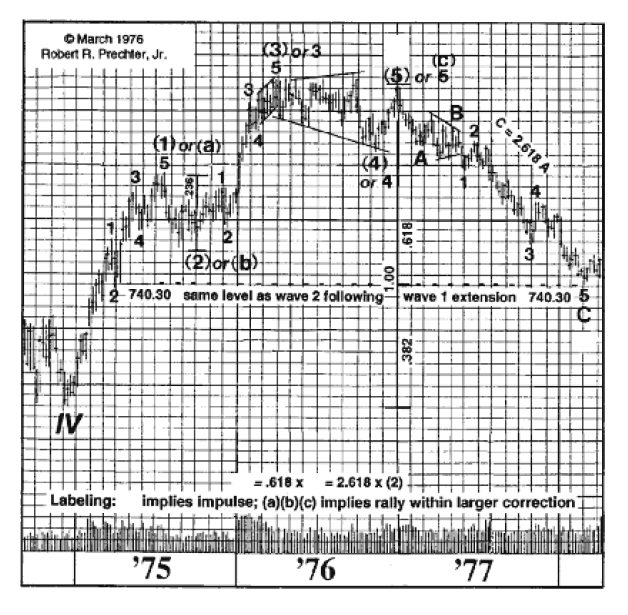
Figure 4-12
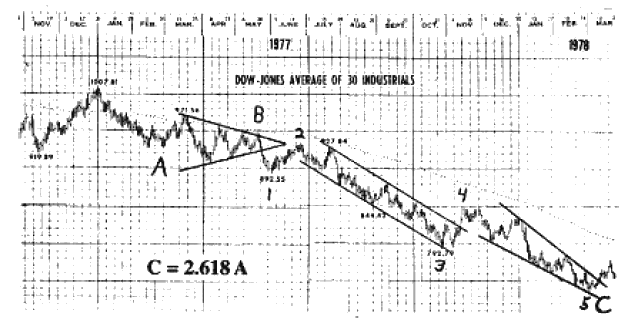
Figure 4-13