A Real-Time Application of Multiple Wave Relationships
Lessons 20 through 26 list a number of ways that knowledge of the Fibonacci ratio's occurrence in market patterns can be used in forecasting. This lesson provides an example of how the ratio was applied in an actual market situation, as published in Robert Prechter's Elliott Wave Theorist.
When approaching the discovery of mathematical relationships in the markets, the Wave Principle offers a mental foothold for the practical thinker. If studied carefully, it can satisfy even the most cynical researcher. A side element of the Wave Principle is the recognition that the Fibonacci ratio is one of the primary governors of price movement in the stock market averages. The reason that a study of the Fibonacci ratio is so compelling is that the 1.618:1 ratio is the only price relationship whereby the length of the shorter wave under consideration is to the length of the longer wave as the length of the longer wave is to the length of the entire distance traveled by both waves, thus creating an interlocking wholeness to the price structure. It was this property that led early mathematicians to dub 1.618 the "Golden Ratio."
The Wave Principle is based on empirical evidence, which led to a working model, which subsequently led to a tentatively developed theory. In a nutshell, the portion of the theory that applies to anticipating the occurrence of Fibonacci ratios in the market can be stated this way:
a) The Wave Principle describes the movement of markets.
b) The numbers of waves in each degree of trend correspond to the Fibonacci sequence.
c) The Fibonacci ratio is the governor of the Fibonacci sequence.
d) The Fibonacci ratio has reason to be evident in the market.
As for satisfying oneself that the Wave Principle describes the movement of markets, some effort must be spent attacking the charts. The purpose of this Lesson is merely to present evidence that the Fibonacci ratio expresses itself often enough in the averages to make it clear that it is indeed a governing force (not necessarily the governing force) on aggregate market prices.
As the years have passed since the "Economic Analysis" section of Lesson 31 was written, the Wave Principle has dramatically proved its utility in forecasting bond prices. Interest rates, after all, are simply the price of an important commodity: money. As a specific example of the Fibonacci ratio's value, we offer the following excerpts from The Elliott Wave Theorist during a seven month period in 1983-84.
The Elliott Wave Theorist
November 1983
Now it's time to attempt a more precise forecast for bond prices. Wave (a) in December futures dropped 11¾ points, so a wave (c) equivalent subtracted from the wave (b) peak at 73½ last month projects a downside target of 61¾. It is also the case that alternate waves within symmetrical triangles are usually related by .618. .As it happens, wave [B] fell 32 points. 32 x .618 = 19¾ points, which should be a good estimate for the length of wave [D]. 19¾ points from the peak of wave [C] at 80 projects a downside target of 60¼. Therefore, the 60¼ - 61¾ area is the best point to be watching for the bottom of the current decline. [See Figure B-14.]
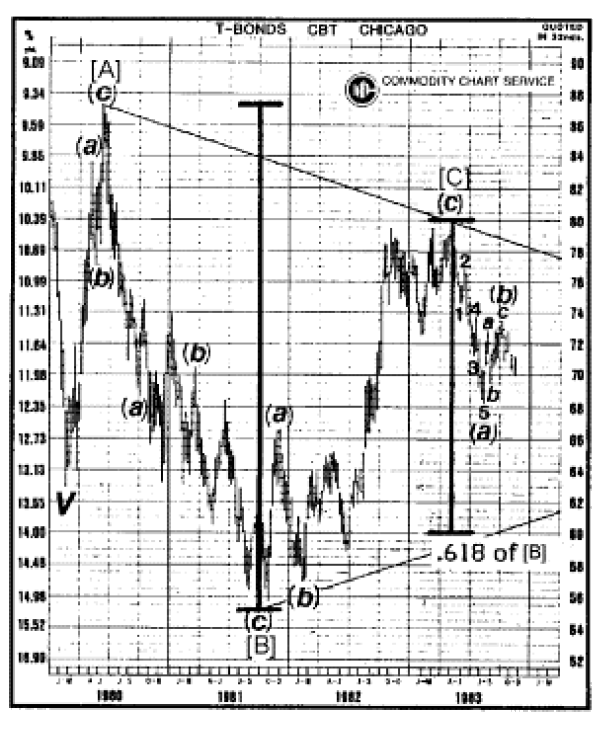
Figure B-14
April 3, 1984 [after (b) ended in a triangle]
The ultimate downside target will probably occur nearer the point at which wave [D] is .618 times as long as wave [B], which took place from June 1980 to September 1981 and traveled 32 points basis the weekly continuation chart. Thus, if wave [D] travels 19¾ points, the nearby contract should bottom at 60¼. In support of this target is the five wave (a), which indicates that a zigzag decline is in force from the May 1983 highs. Within zigzags, waves "A" and "C" are typically of equal length. Basis the June contract, wave (a) fell 11 points. 11 points from the triangle peak at 70¾ projects 59¾, making the 60 zone (+ or - ¼) a point of strong support and a potential target. As a final calculation, thrusts following triangles usually fall approximately the distance of the widest part of the triangle (as discussed in Lesson 8). Based on [Figure B-15], that distance is 10½ points, which subtracted from the triangle peak gives 60¼ as a target.
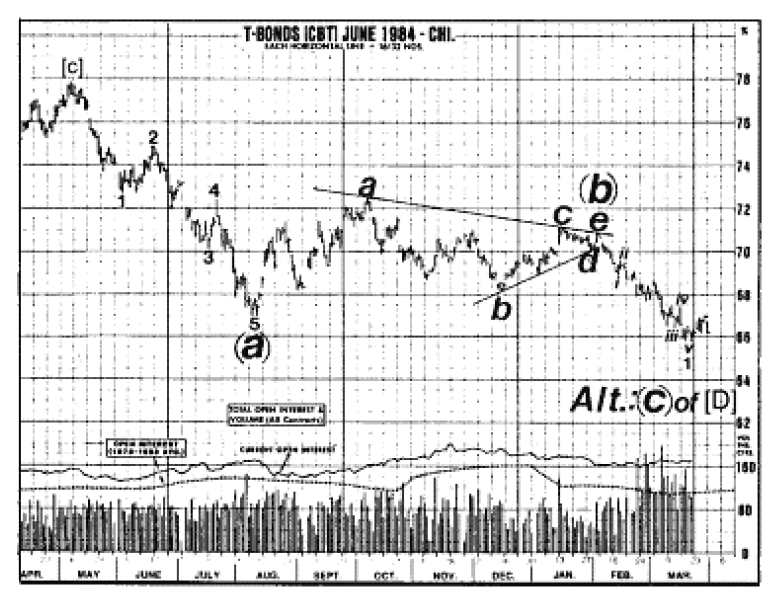
Figure B-15
June 4, 1984
The most exciting event of 1984 is the apparent resolution of the one-year decline in bond prices. Investors were cautioned to hold off buying until bonds reached the 59¾-60¼ level. On May 30, the day that level was achieved, rumors about Continental Illinois Bank were flying, the 1100 level on the Dow was smashed in the morning on -650 ticks, and the June bonds, amid panic selling, ticked briefly to as low as 59½, just touching the triangle support line drawn on the chart last month. It stopped cold right there and closed at 59 31/32, just 1/32 of a point from the exact center of our target zone. In the two and a half days following that low, bonds have rebounded two full points in a dramatic reversal.
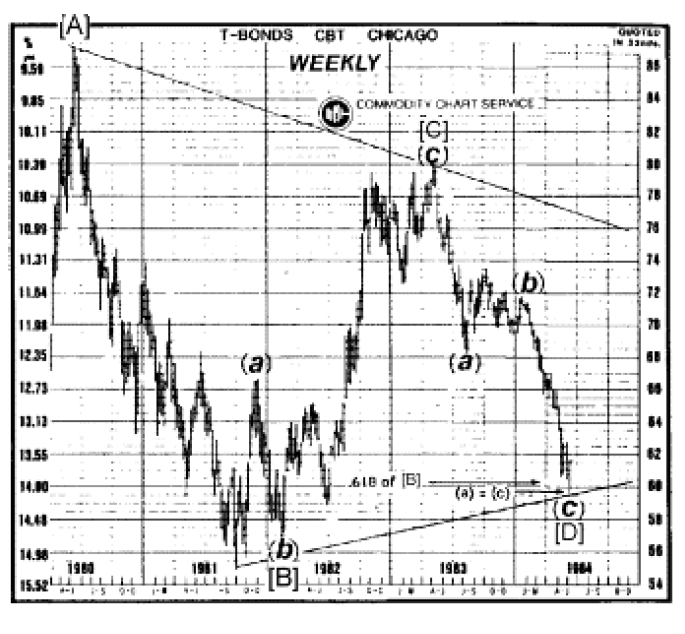
Figure B-16
July 11, 1984
The background of investor psychology is very suggestive of an important bond market low [see Figure B-18]. In fact, if this were the only measure I followed, it would appear that bonds are the buy of a lifetime. The news media, which all but ignored the rise in interest rates until May 1984, has been flooding the pages of the press with "higher interest rate" stories. Most of these came out, in typical fashion, after the May low, which was tested in June. During second waves, investors typically relive the fears that exited at the actual bottom, while the market demonstrates an understanding, by holding above the previous low, that the worst has passed. The last five weeks have demonstrated this phenomenon vividly.
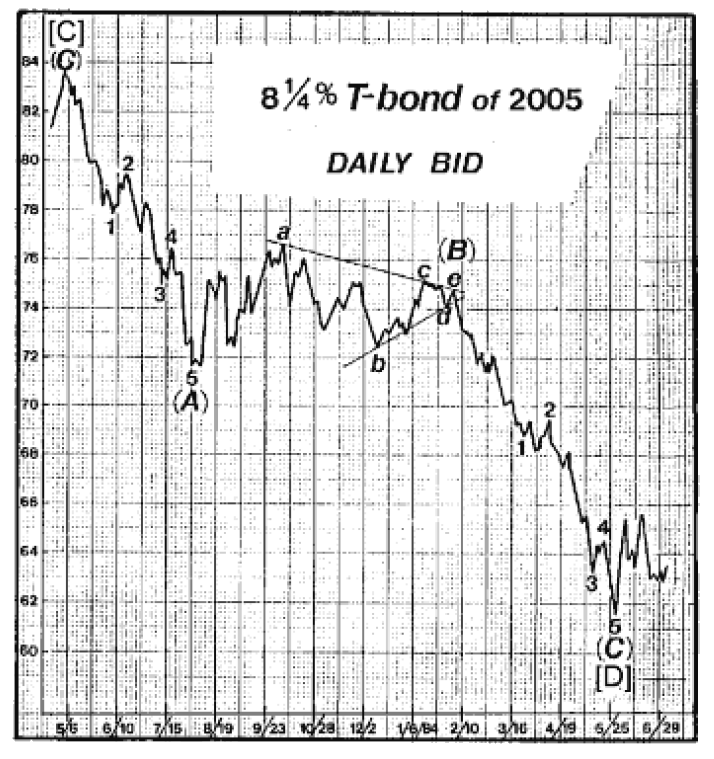
Figure B-17
On June 11, the Wall Street Journal headline read, "Fed Move to Tighten Credit is Expected During the Summer by Many Economists." On June 18, two full articles, including a front page feature, focused on the prospects for higher interest rates: "Cooler Economy Seen Failing to Stem Further Rise in Interest Rates This Year," and "Interest Rates Begin to Damp Economy; Many Analysts See Further Increases." On June 22, the WSJ featured an incredible five-page in-depth report entitled "World Debt in Crisis," complete with a picture of falling dominoes and quotes like these: from a congressman, "I don't think we're going to make it to the 1990s"; from a V.P. at Citicorp, "Let's be clear — nobody's debts are going to be repaid"; and from a former assistant Secretary of State for economic affairs, "We are living on borrowed time and borrowed money." On July 2, the WSJ reported, without saying so, that economists have panicked. Their forecasts for higher rates now extend halfway into next year! The headline read, "Higher Interest Rates Are Predicted for Rest of Year And Further Rises Are Seen for 1985's First Six Months." Says the article, "Some say it would take a miracle for rates to fall." The WSJ is not alone in taking the pulse of economists. Financial World magazine's June 27 poll listed the forecasts of 24 economists against their beginning-of-year predictions. Every single one of them has raised his forecast in a linear-logic reaction to the rise in rates that has already occurred. They are using the same type of thinking that led them to a "lower interest rates ahead" conclusion a year ago, at the bottom. This overwhelming consensus based on fundamental analysis is no guarantee that rates have peaked, but history shows that this type of analysis will rarely result in market success. I prefer to bet on an overlooked theory which recognizes that market patterns repeat themselves over and over again because people are people.
As further developments proved, that low marked the last buying opportunity prior to the start of a historical advance in bond prices. Fibonacci ratio analysis, applied with a knowledge of where such relationships are to be expected, forecasted the level of the low, which was then powerfully affirmed as it occurred.