Technical and Economic Analysis
The Elliott Wave Principle not only proves the validity of chart analysis, but it can help the technician decide which formations are most likely of real significance. As in the Wave Principle, technical analysis (as described by Robert D. Edwards and John Magee in their book, Technical Analysis of Stock Trends) recognizes the "triangle" formation as generally an intra-trend phenomenon. The concept of a "wedge" is the same as that for Elliott's diagonal triangle and has the same implications. Flags and pennants are zigzags and triangles. "Rectangles" are usually double or triple threes. Double tops are generally caused by flats, double bottoms by truncated fifths.
The famous "head and shoulders" pattern can be discerned in a normal Elliott top (see Figure 7-3), while a head and shoulders pattern that "doesn't work out" might involve an expanded flat correction under Elliott (see Figure 7-4). Note that in both patterns, the decreasing volume that usually accompanies a head and shoulders formation is a characteristic fully compatible with the Wave Principle. In Figure 7-3, wave 3 will have the heaviest volume, wave 5 somewhat lighter, and wave b usually lighter still when the wave is of Intermediate degree or lower. In Figure 7-4, the impulse wave will have the highest volume, wave b usually somewhat less, and wave four of c the least.
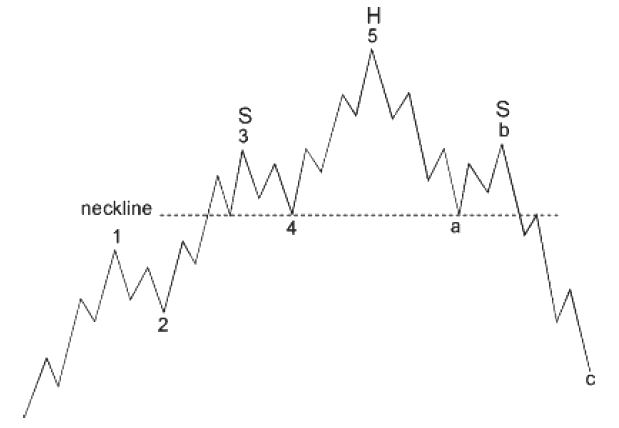
Figure 7-3
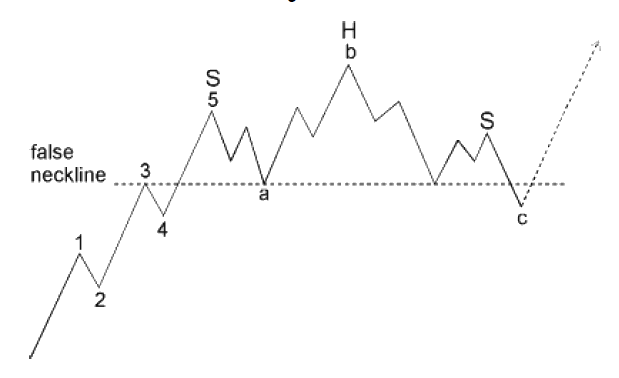
Figure 7-4
Trendlines and trend channels are used similarly in both approaches. Support and resistance phenomena are evident in normal wave progression and in the limits of bear markets (the congestion of wave four is support for a subsequent decline). High volume and volatility (gaps) are recognized characteristics of "breakouts," which generally accompany third waves, whose personality, as discussed in Lesson 14, fills the bill.
Despite this compatibility, after years of working with the Wave Principle we find that applying classical technical analysis to stock market averages gives us the feeling that we are restricting ourselves to the use of stone tools in an age of modern technology.
The technical analytic tools known as "indicators" are often extremely useful in judging and confirming the momentum status of the market or the psychological background that usually accompanies waves of each type. For instance, indicators of investor psychology, such as those that track short selling, option transactions and market opinion polls, reach extreme levels at the end of "C" waves, second waves and fifth waves. Momentum indicators reveal an ebbing of the market's power (i.e., speed of price change, breadth and in lower degrees, volume) in fifth waves and in "B" waves in expanded flats, creating "momentum divergences." Since the utility of an individual indicator can change or evaporate over time due to changes in market mechanics, we strongly suggest their use as tools to aid in correctly counting Elliott waves but would not rely on them so strongly as to ignore wave counts of obvious portent. Indeed, the associated guidelines within the Wave Principle at times have suggested a market environment that made the temporary alteration or impotence of some market indicators predictable.
The "Economic Analysis" Approach
Currently extremely popular with institutional fund managers is the method of trying to predict the stock market by forecasting changes in the economy using interest rate trends, typical postwar business cycle behavior, rates of inflation and other measures. In our opinion, attempts to forecast the market without listening to the market itself are doomed to fail. If anything, the past shows that the market is a far more reliable predictor of the economy than vice versa. Moreover, taking a long term historical perspective, we feel strongly that while various economic conditions may be related to the stock market in certain ways during one period of time, those relationships are subject to change seemingly without notice. For example, sometimes recessions begin near the start of a bear market, and sometimes they do not occur until the end. Another changing relationship is the occurrence of inflation or deflation, each of which has appeared bullish for the stock market in some cases and bearish for the stock market in others. Similarly, tight money fears have kept many fund managers out of the market at the 1984 bottom, just as the lack of such fears kept them invested during the 1962 collapse. Falling interest rates often accompany bull markets but also accompany the very worst market declines, such as that of 1929-1932.
While Elliott claimed that the Wave Principle was manifest in all areas of human endeavor, even in the frequency of patent applications, for instance, the late Hamilton Bolton specifically asserted that the Wave Principle was useful in telegraphing changes in monetary trends as far back as 1919. Walter E. White, in his work, "Elliott Waves in the Stock Market," also finds wave analysis useful in interpreting the trends of monetary figures, as this excerpt indicates:
The rate of inflation has been a very important influence on stock market prices during recent years. If percentage changes (from one year earlier) in the consumer price index are plotted, the rate of inflation from 1965 to late 1974 appears as an Elliott 1-2-3-4-5 wave. A different cycle of inflation than in previous postwar business cycles has developed since 1970 and the future cyclical development is unknown. The waves are useful, however, in suggesting turning points, as in late 1974.
Elliott Wave concepts are useful in the determination of turning points in many different series of economic data. For instance, net free banking reserves, which White said "tend to precede turning points in the stock market," were essentially negative for about eight years from 1966 to 1974. The termination of the 1-2-3-4-5 Elliott down wave in late 1974 suggested a major buying point.
As testimony to the utility of wave analysis in the money markets, we present in Figure 7-5 a wave count of the price of a long term U.S. Treasury bond, the 8 and 3/8 of the year 2000. Even in this brief nine-month price pattern, we see a reflection of the Elliott process. On this chart we have three examples of alternation, as each second wave alternates with each fourth, one being a zigzag, the other a flat. The upper trendline contains all rallies. The fifth wave constitutes an extension, which itself is contained within a trend channel. This chart indicates that the biggest bond market rally in almost a year was to begin quite soon. (Further evidence of the applicability of the Wave Principle to forecasting interest rates was presented in Lesson 24.)
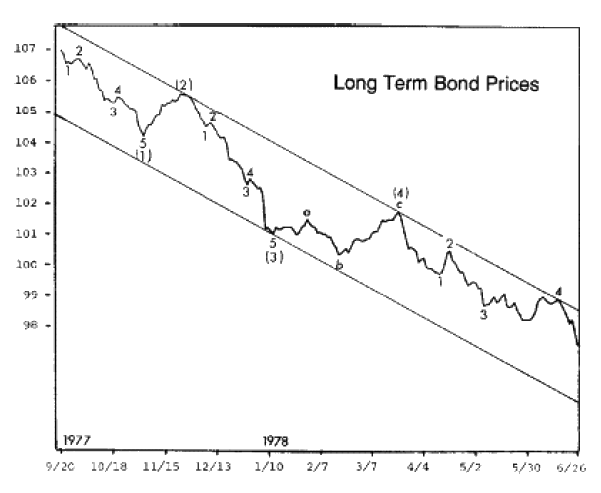
Figure 7-5
Thus, while expenditures, credit expansion, deficits and tight money can and do relate to stock prices, our experience is that an Elliott pattern can always be discerned in the price movement. Apparently, what influences investors in managing their portfolios is likely influencing bankers, businessmen and politicians as well. It is difficult to separate cause from effect when the interactions of forces at all levels of activity are so numerous and intertwined. Elliott waves, as a reflection of the mass psyche, extend their influence over all categories of human behavior.
Exogenous Forces
We do not reject the idea that exogenous forces may be triggering cycles and patterns that man has yet to comprehend. For instance, for years analysts have suspected a connection between sunspot frequency and stock market prices on the basis that changes in magnetic radiation have an effect on the mass psychology of people, including investors. In 1965, Charles J. Collins published a paper entitled "An Inquiry into the Effect of Sunspot Activity on the Stock Market." Collins noted that since 1871, severe bear markets generally followed years when sunspot activity had risen above a certain level. More recently, Dr. R. Burr, in Blueprint for Survival, reported that he had discovered a striking correlation between geophysical cycles and the varying level of electrical potential in plants. Several studies have indicated an effect on human behavior from changes in atmospheric bombardment by ions and cosmic rays, which may in turn be effected by lunar and planetary cycles. Indeed, some analysts successfully use planetary alignments, which apparently affect sunspot activity, to predict the stock market. In October 1970, The Fibonacci Quarterly (issued by The Fibonacci Association, Santa Clara University, Santa Clara, CA) published a paper by B.A. Read, a captain with the U.S. Army Satellite Communications Agency. The article is entitled "Fibonacci Series in the Solar System" and establishes that planetary distances and periods conform to Fibonacci relationships. The tie-in with the Fibonacci sequence suggests that there may be more than a random connection between stock market behavior and the extraterrestrial forces affecting life on Earth. Nevertheless, we are content for the time being to assume that Elliott Wave patterns of social behavior result from the mental and emotional makeup of men and their resulting behavioral tendencies in social situations. If these tendencies are triggered or tied to exogenous forces, someone else will have to prove the connection.