Phi and the Stock Market
The stock market's patterns are repetitive (and fractal, to use today's terminology) in that the same basic pattern of movement that shows up in minor waves, using hourly plots, shows up in Supercycles and Grand Supercycles, using yearly plots. Figures 3-12 and 3-13 show two charts, one reflecting the hourly fluctuations in the Dow over a ten day period from June 25th to July 10th, 1962 and the other a yearly plot of the S&P 500 Index from 1932 to 1978 (courtesy of The Media General Financial Weekly). Both plots indicate similar patterns of movement despite a difference in the time span of over 1500 to 1. The long term formulation is still unfolding, as wave V from the 1974 low has not run its full course, but to date the pattern is along lines parallel to the hourly chart. Why? Because in the stock market, form is not a slave to the time element. Under Elliott's rules, both short and long term plots reflect a 5-3 relationship that can be aligned with the form that reflects the properties of the Fibonacci sequence of numbers. This truth suggests that collectively, man's emotions, in their expression, are keyed to this mathematical law of nature.
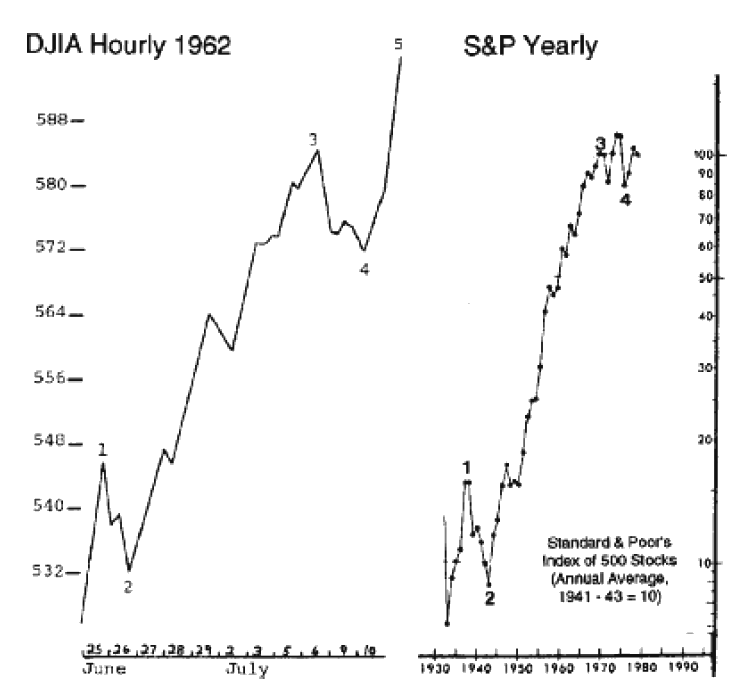
Figure 3-12 and Figure 3-13
Now compare the formations shown in Figures 3-14 and 3-15. Each illustrates the natural law of the inwardly directed Golden Spiral and is governed by the Fibonacci ratio. Each wave relates to the previous wave by .618. In fact, the distances in terms of the Dow points themselves reflect Fibonacci mathematics. In Figure 3-14, showing the 1930-1942 sequence, the market swings cover approximately 260, 160, 100, 60, and 38 points respectively, closely resembling the declining list of Fibonacci ratios: 2.618, 1.618, 1.00, .618 and .382.
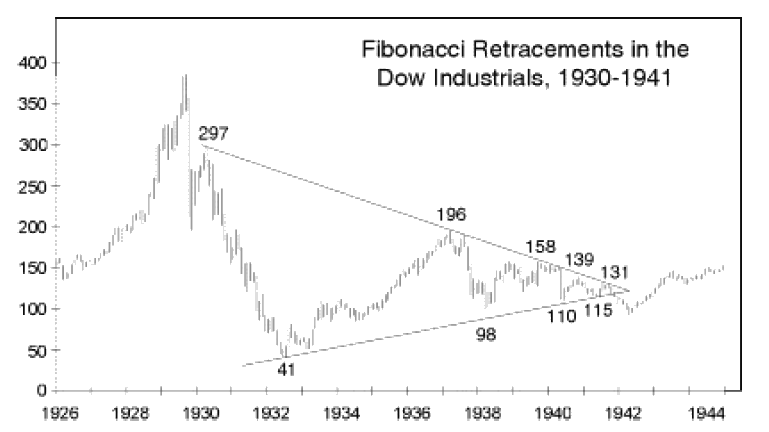
Figure 3-14
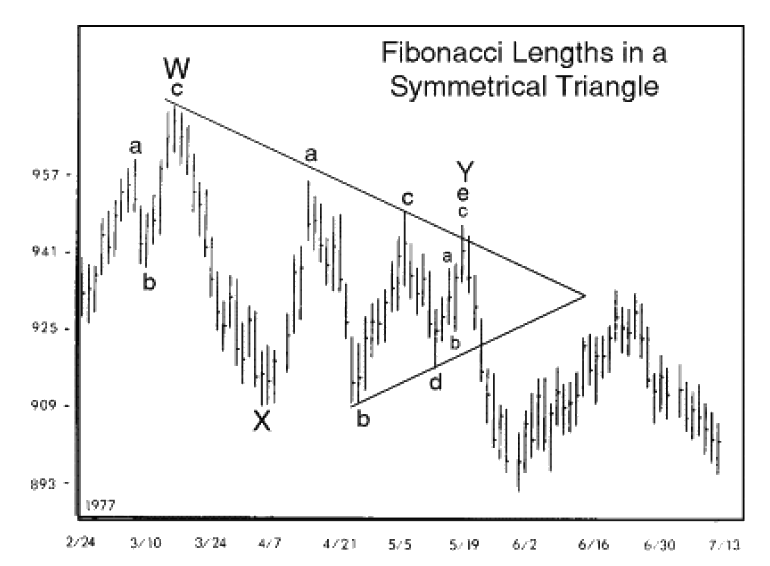
Figure 3-15
Starting with wave X in the 1977 upward correction shown in Figure 3-15, the swings are almost exactly 55 points (wave X), 34 points (waves A through C), 21 points (wave d), 13 points (wave a of e) and 8 points (wave b of e), the Fibonacci sequence itself. The total net gain from beginning to end is 13 points, and the apex of the triangle lies exactly on the level of the correction's beginning at 930, which is also the level of the peak of the subsequent reflex rally in June. Whether one takes the actual number of points in the waves as coincidence or part of the design, one can be certain that the precision manifest in the constant .618 ratio between each successive wave is not coincidence. Lessons 20 through 25 and 30 will elaborate substantially on the appearance of the Fibonacci ratio in market patterns.
Fibonacci Mathematics in the Structure of the Wave Principle
Even the ordered structural complexity of Elliott Wave forms reflects the Fibonacci sequence. There is 1 basic form: the five wave sequence. There are 2 modes of waves: motive (which subdivide into the cardinal class of waves, numbered) and corrective (which subdivide into the consonant class of waves, lettered). There are 3 orders of simple patterns of waves: fives, threes and triangles (which have characteristics of both fives and threes). There are 5 families of simple patterns: impulse, diagonal triangle, zigzag, flat and triangle. There are 13 variations of simple patterns: impulse, ending diagonal, leading diagonal, zigzag, double zigzag, triple zigzag, regular flat, expanded flat, running flat, contracting triangle, descending triangle, ascending triangle and expanding triangle.
The corrective mode has two groups, simple and combined, bringing the total number of groups to 3. There are 2 orders of corrective combinations (double correction and triple correction), bringing the total number of orders to 5. Allowing only one triangle per combination and one zigzag per combination (as required), there are 8 families of corrective combinations in all: zig/flat, zig/tri., flat/flat, flat/tri., zig/flat/flat, zig/flat/tri., flat/flat/flat and flat/flat/tri., which brings the total number of families to 13. The total number of simple patterns and combination families is 21.
Figure 3-16 is a depiction of this developing tree of complexity. Listing permutations of those combinations, or further variations of lesser importance within waves, such as which wave, if any, is extended, which ways alternation is satisfied, whether an impulse does or does not contain a diagonal triangle, which types of triangles are in each of the combinations, etc., may serve to keep this progression going.
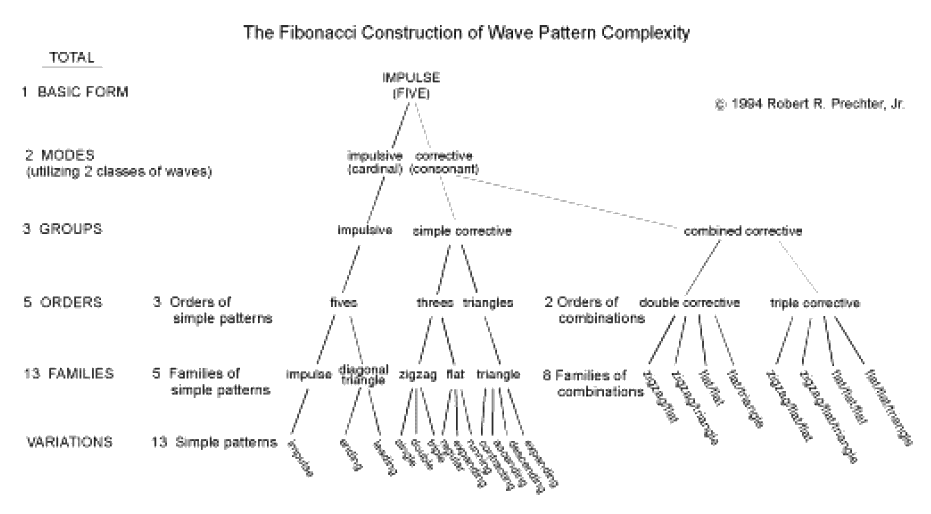
Figure 3-16
There may be an element of contrivance in this ordering process, as one can conceive of some possible variations in acceptable categorization. Still, that a principle about Fibonacci appears to reflect Fibonacci is itself worth some reflection.
Phi and Additive Growth
As we will show in subsequent lessons, the spiral-like form of market action is repeatedly shown to be governed by the Golden Ratio, and even Fibonacci numbers appear in market statistics more often than mere chance would allow. However, it is crucial to understand that while the numbers themselves do have theoretic weight in the grand concept of the Wave Principle, it is the ratio that is the fundamental key to growth patterns of this type. Although it is rarely pointed out in the literature, the Fibonacci ratio results from this type of additive sequence no matter what two numbers start the sequence. The Fibonacci sequence is the basic additive sequence of its type since it begins with the number "1" (see Figure 3-17), which is the starting point of mathematical growth. However, we may also take any two randomly selected numbers, such as 17 and 352, and add them to produce a third, continuing in that manner to produce additional numbers. As this sequence progresses, the ratio between adjacent terms in the sequence always approaches the limit phi very quickly. This relationship becomes obvious by the time the eighth term is produced (see Figure 3-18). Thus, while the specific numbers making up the Fibonacci sequence reflect the ideal progression of waves in markets, the Fibonacci ratio is a fundamental law of geometric progression in which two preceding units are summed to create the next. That is why this ratio governs so many relationships in data series relating to natural phenomena of growth and decay, expansion and contraction, and advancement and retreat.
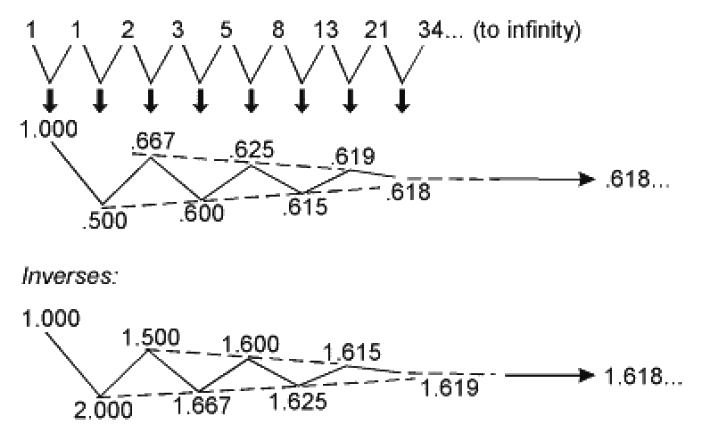
Figure 3-17
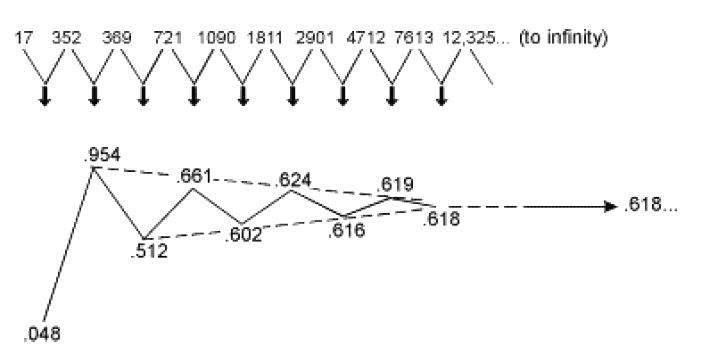
Figure 3-18
In its broadest sense, the Elliott Wave Principle proposes that the same law that shapes living creatures and galaxies is inherent in the spirit and activities of men en masse. The Elliott Wave Principle shows up clearly in the market because the stock market is the finest reflector of mass psychology in the world. It is a nearly perfect recording of man's social psychological states and trends, which produce the fluctuating valuation of his own productive enterprise, making manifest its very real patterns of progress and regress. What the Wave Principle says is that mankind's progress (of which the stock market is a popularly determined valuation) does not occur in a straight line, does not occur randomly, and does not occur cyclically. Rather, progress takes shape in a "three steps forward, two steps back" fashion, a form that nature prefers. In our opinion, the parallels between and Wave Principle and other natural phenomena are too great to be dismissed as just so much nonsense. On the balance of probabilities, we have come to the conclusion that there is a principle, everywhere present, giving shape to social affairs, and that Einstein knew what he was talking about when he said, "God does not play dice with the universe." The stock market is no exception, as mass behavior is undeniably linked to a law that can be studied and defined. The briefest way to express this principle is a simple mathematical statement: the 1.618 ratio.
The Desiderata, by poet Max Ehrmann, reads, "You are a child of the Universe, no less than the trees and the stars; you have a right to be here. And whether or not it is clear to you, no doubt the Universe is unfolding as it should." Order in life? Yes. Order in the stock market? Apparently.