Commodities
Commodities have as much individual character as stocks. One difference between the behavior of commodities and stock market averages is that in commodities, primary bull and bear markets at times overlap each other. Sometimes, for instance, a complete five-wave bull market will fail to take a commodity to a new all-time high, as the chart of soybeans illustrates in Figure 6-9. Therefore, while beautiful charts of Supercycle degree waves do exist for a number of commodities, it seems that the peak observable degree in some cases is the Primary or Cycle degree. Beyond this degree, the Principle gets bent here and there.
Also in contrast to the stock market, commodities most commonly develop extensions in fifth waves within Primary or Cycle degree bull markets. This tendency is entirely consistent with the Wave Principle, which reflects the reality of human emotions. Fifth wave advances in the stock market are propelled by hope, while fifth wave advances in commodities are propelled by a comparatively dramatic emotion, fear: fear of inflation, fear of drought, fear of war. Hope and fear look different on a chart, which is one of the reasons that commodity market tops often look like stock market bottoms. Commodity bull market extensions, moreover, often appear following a triangle in the fourth wave position. Thus, while post-triangle thrusts in the stock market are often "swift and short," triangles in commodity bull markets of large degree often precede extended blowoffs. One example is shown in the chart of silver in Figure 1-44.
The best Elliott patterns are born from important long term breakouts from extended sideways base patterns, as occurred in coffee, soybeans, sugar, gold and silver at different times in the 1970s. Unfortunately, semilogarithmic chart scale, which may have indicated applicability of Elliott trend channels, was not available for this study.
Figure 6-8 shows the progress of the two year price explosion in coffee from mid-1975 to mid-1977. The pattern is unmistakably Elliott, even down to Minor wave degree. The ratio analyses employed beautifully project the peak price level. In these computations, the length of the rise to the peak of wave (3) and to the peak of wave 3 each divide the bull market into the Golden Section at equivalent distances. As you can see by the equally acceptable counts listed at the bottom of the chart, both of those peaks can be labeled as the top of wave [3], fulfilling typical ratio analysis guidelines. After the peak of the fifth wave was reached, a devastating bear market struck apparently from out of the blue.
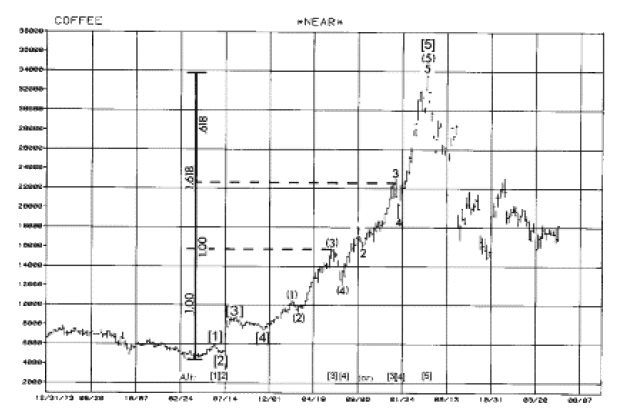
Figure 6-8
Figure 6-9 displays five and a half years of price history for soybeans. The explosive rise in 1972-73 emerged from a long base, as did the explosion in coffee prices. The target area is met here as well, in that the length of the rise to the peak of wave 3, multiplied by 1.618, gives almost exactly the distance from the end of wave 3 to the peak of wave 5. In the ensuing A-B-C bear market, a perfect Elliott zigzag unfolds, bottoming in January 1976. Wave B of this correction is just shy of .618 times the length of wave A. A new bull market takes place in 1976-77, although of subnormal extent since the peak of wave 5 falls just short of the expected minimum target of $10.90. In this case, the gain to the peak of wave 3 ($3.20) times 1.618 gives $5.20, which when added to the low within wave 4 at $5.70 gives the $10.90 target. In each of these bull markets, the initial measuring unit is the same, the length of the advance from its beginning to the peak of wave three. That distance is then .618 times the length of wave 5, measured from the peak of wave 3, the low of wave 4, or in between. In other words, in each case, some point within wave 4 divides the entire rise into the Golden Section, as described in Lesson 21.
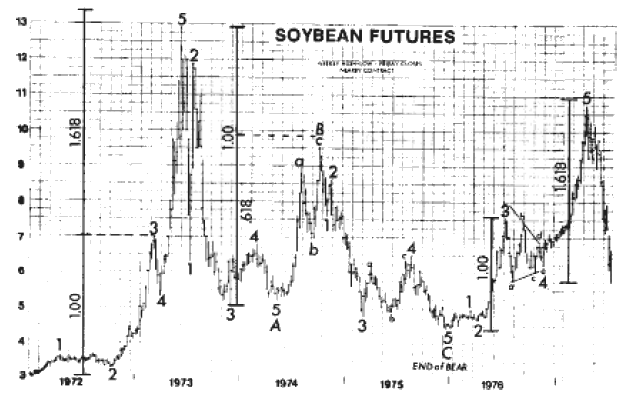
Figure 6-9
Figure 6-10 is a weekly high-low chart of Chicago wheat futures. During the four years after the peak at $6.45, prices trace out an Elliott A-B-C bear market with excellent internal interrelationships. Wave B is a contracting triangle. The five touch points conform perfectly to the boundaries of the trendlines. Though in an unusual manner, the triangle's subwaves develop as a reflection of the Golden Spiral, with each leg related to another by the Fibonacci ratio (c = .618b; d = .618a; e = .618d). A typical "false breakout" occurs near the end of the progression, although this time it is accomplished not by wave e, but by wave 2 of C. In addition, the wave A decline is approximately 1.618 times the length of wave a of B, and of wave C.
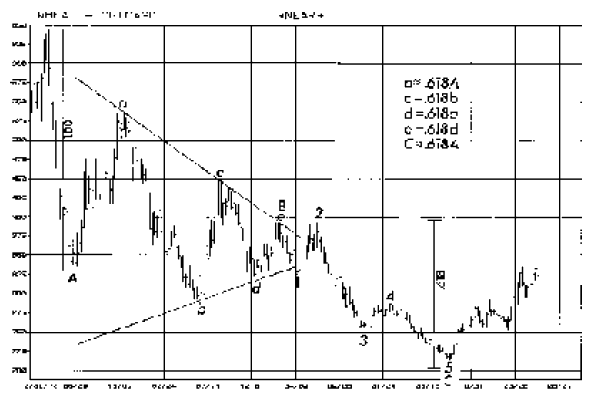
Figure 6-10
Thus, we can demonstrate that commodities have properties that reflect the universal order that Elliott discovered. It seems reasonable to expect, though, that the more individual the personality of a commodity, which is to say, the less it is a necessary part of human existence, the less it will reliably reflect an Elliott pattern. One commodity that is unalterably tied to the psyche of mass humanity is gold.
Gold
Gold often moves "contra-cyclically" to the stock market. When the price of gold reverses to the upside after a downtrend, it can often occur concurrently with a turn for the worse in stocks, and vice versa. Therefore, an Elliott reading of the gold price has in the recent past provided confirming evidence for an expected turn in the Dow.
In April of 1972, the long-standing "official" price of gold was increased from $35 an ounce to $38 an ounce, and in February of 1973 was again increased to $42.22. This fixed "official" price established by central banks for convertibility purposes and the rising trend in the unofficial price in the early seventies led to what was called the "two-tier" system. In November 1973, the official price and the two-tier system were abolished by the inevitable workings of supply and demand in the free market. The free market price of gold rose from $35 per ounce in January 1970 and reached a closing "London fix" price peak of $197 an ounce on December 30, 1974. The price then started to slide, and on August 31, 1976 reached a low of $103.50. The fundamental "reasons" given for this decline have always been U.S.S.R. gold sales, U.S. Treasury gold sales and I.M.F. auctions. Since then, the price of gold has recovered substantially and is trending upward again [as of 1978].
Despite both the efforts of the U.S. Treasury to diminish gold's monetary role, the highly charged emotional factors affecting gold as a store of value and a medium of exchange have produced an inescapably clear Elliott pattern. Figure 6-11 is a price chart of London gold, and on it we have indicated the correct wave count, in which the rise from the freemarket liftoff to the peak at $179.50 an ounce on April 3rd, 1974 is a completed five-wave sequence. The officially maintained price of $35 an ounce before 1970 prevented any wave formation prior to that time and thus helped create the necessary long term base. The dynamic breakout from that base fits well the criterion for the clearest Elliott count for a commodity, and clear it is.
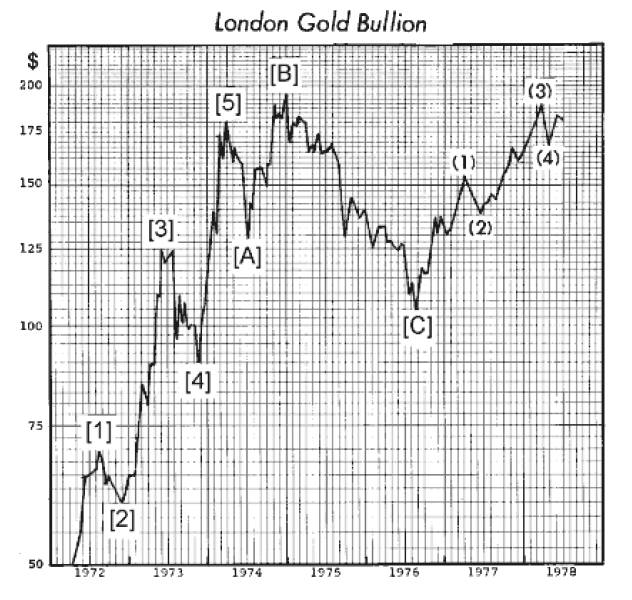
Figure 6-11
The rocketing five-wave advance forms a nearly perfect wave, with the fifth terminating well against the upper boundary of the trend channel. The Fibonacci target projection method typical of commodities is fulfilled, in that the $90 rise to the peak of wave [3] provides the basis for measuring the distance to the orthodox top. $90 x .618 = $55.62, which when added to the peak of wave III at $125, gives $180.62. The actual price at wave V's peak was $179.50, quite close indeed. Also noteworthy is that at $179.50, the price of gold had multiplied by just over five (a Fibonacci number) times its price at $35.
Then in December 1974, after the initial wave [A] decline, the price of gold rose to an all-time high of nearly $200 an ounce. This wave was wave [B] of an expanded flat correction, which crawled upward along the lower channel line, as corrective wave advances often do. As befits the personality of a "B" wave, the phoniness of the advance was unmistakable. First, the news background, as everyone knew, appeared to be bullish for gold, with American legalization of ownership due on January 1, 1975. Wave [B], in a seemingly perverse but market-logical manner, peaked precisely on the last day of 1974. Secondly, gold mining stocks, both North American and South African, were noticeably under-performing on the advance, forewarning of trouble by refusing to confirm the assumed bullish picture.
Wave [C], a devastating collapse, accompanied a severe decline in the valuation of gold stocks, carrying some back to where they had begun their advances in 1970. In terms of the bullion price, the authors computed in early 1976 by the usual relationship that the low should occur at about $98, since the length of wave [A] at $51, times 1.618, equals $82, which when subtracted from the orthodox high at $180, gives a target at $98. The low for the correction was well within the zone of the previous fourth wave of lesser degree and quite near the target, hitting a closing London price of $103.50 on August 25, 1976, the month just between the Dow Theory stock market peak in July and the nominal DJIA peak in September. The [A]-[B]-[C] expanded flat correction implies great thrust in the next wave into new high ground.
Gold, historically speaking, is one of the disciplines of economic life, with a sound record of achievement. It has nothing more to offer the world than discipline. Perhaps that is the reason politicians work tirelessly to ignore it, denounce it, and attempt to demonetize it. Somehow, though, governments always seem to manage to have a supply on hand "just in case." Today, gold stands in the wings of international finance as a relic of the old days, but nevertheless also as a harbinger of the future. The disciplined life is the productive life, and that concept applies to all levels of endeavor, from dirt farming to international finance.
Gold is the time honored store of value, and although the price of gold may flatten for a long period, it is always good insurance to own some until the world's monetary system is intelligently restructured, a development that seems inevitable, whether it happens by design or through natural economic forces. That paper is no substitute for gold as a store of value is probably another of nature's laws.