The Wave Pattern Up to 1978
The Grand Supercycle from 1789
This long wave has the right look of three waves in the direction of the main trend and two against the trend for a total of five, complete with an extended third wave corresponding with the most dynamic and progressive period of U.S. history. In Figure 5-2, the Supercycle subdivisions have been marked (I), (II), (III), (IV) and (V).
Considering that we are exploring market history back to the days of canal companies, horse-drawn barges and meager statistics, it is surprising that the record of "constant dollar" industrial share prices, which was developed by Gertrude Shirk for Cycles magazine, forms such a clear Elliott pattern. Especially striking is the trend channel, the baseline of which connects several important Cycle and Supercycle wave lows and the upper parallel of which connects the peaks of several advancing waves.
Wave (I) is a fairly clear "five," assuming 1789 to be the beginning of the Supercycle. Wave (II) is a flat, which neatly predicts a zigzag or triangle for wave (IV), by rule of alternation. Wave (III) is extended and can be easily subdivided into the necessary five subwaves, including an expanding triangle characteristically in the fourth Cycle wave position. Wave (IV), from 1929 to 1932, terminates within the area of the fourth wave of lesser degree. An inspection of wave (IV) in Figure 5-3 illustrates in greater detail the zigzag of Supercycle dimension that marked the most devastating market collapse in U.S. history. In wave A of the decline, daily charts show that the third subwave, in characteristic fashion, included the Wall Street crash of October 29, 1929. Wave A was then retraced approximately 50% by wave B, the "famous upward correction of 1930," as Richard Russell terms it, during which even Robert Rhea was led by the emotional nature of the rally to cover his short positions. Wave C finally bottomed at 41.22, a drop of 253 points or about 1.382 times the length of wave A, and completed an 89 (a Fibonacci number) percent drop in stock prices in three (another Fibonacci number) years.
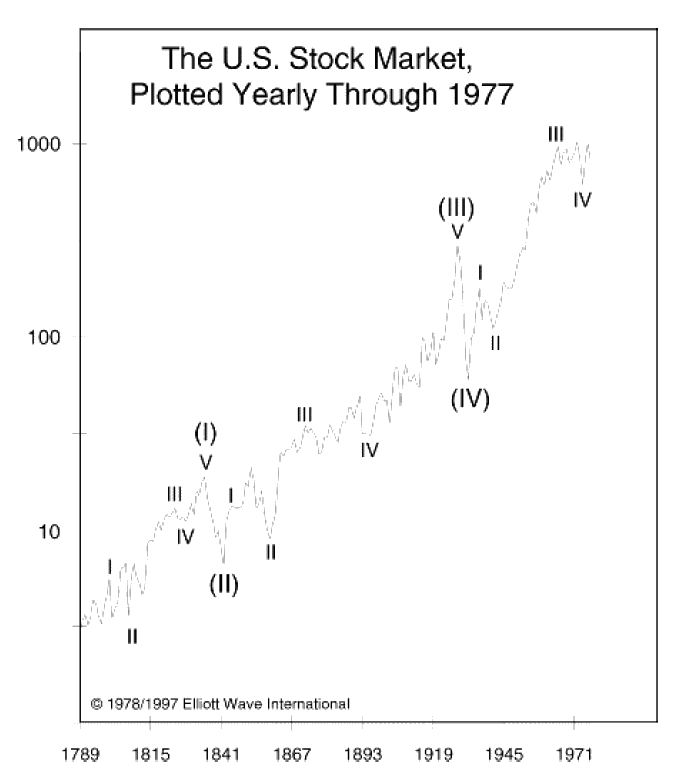
Figure 5-2
Wave (V) of this Grand Supercycle is still in progress, [as of 1978] and is further analyzed below.
The Supercycle Wave from 1932
Supercycle wave (V) has been in progress since 1932 and is still unfolding (see Figure 5-3). If there were such a thing as a perfect wave formation under the Wave Principle, this long term sequence of Elliott waves would be a prime candidate. The breakdown of Cycle waves is as follows:
Wave I: 1932 to 1937 — This wave is a clear cut five-wave sequence according to the rules established by Elliott. It retraces .618 of the market decline from the 1928 and 1930 highs and, within it, the extended fifth wave travels 1.618 times the distance of the first through third waves.
Wave II: 1937 to 1942 — Within wave II, subwave [A] is a five, and wave [C] is a five, so the entire formation is a zigzag. Most of the price damage occurs in wave [A]. Thus, there is great strength in the structure of the entire corrective wave, much beyond what we would normally expect, as wave [C] travels only slightly into new low ground for the correction. Most of the damage of wave [C] was time based or erosive, as continued deflation pushed stock prices to price/earnings levels which were below those even in 1932. A wave of this construction can have the power of a flat.
Wave III: 1942 to 1965(6) — This wave is an extension, by which the Dow rose nearly 1000% in twenty-four years. Its principal features are as follows:
1) Wave [4] is a flat, alternating with a zigzag, wave [2].
2) Wave [3] is the longest Primary wave and an extension.
3) Wave [4] corrects to near the top of the preceding fourth wave of one lesser degree and holds well above the peak of wave [1].
4) The length of subwaves [1] and [5] are related by the Fibonacci ratio in terms of percentage advance (129% and 80% respectively, where 80 = 129 x .618), as is often the case between two nonextended waves.
Wave IV: 1965(6) to 1974 — In Figure 5-3, wave IV bottoms in the area of wave [4], as is normal, and holds well above the peak of wave I. Two possible interpretations are shown: a five-wave expanding triangle from February 1965 and a double three from January 1966. Both counts are admissible, although the triangle interpretation might suggest a lower objective, where wave V would trace an advance approximately as long as the widest part of the triangle. No other Elliott evidence, however, suggests that such a weak wave is in the making. Some Elliott theorists attempt to count the last decline from January 1973 to December 1974 as a five, thus labeling Cycle wave IV a large flat. Our technical objections to a five-wave count are that the supposed third subwave is too short, and the first wave is then overlapped by the fourth, thereby offending two of Elliott's basic rules. It is clearly an A-BC decline.
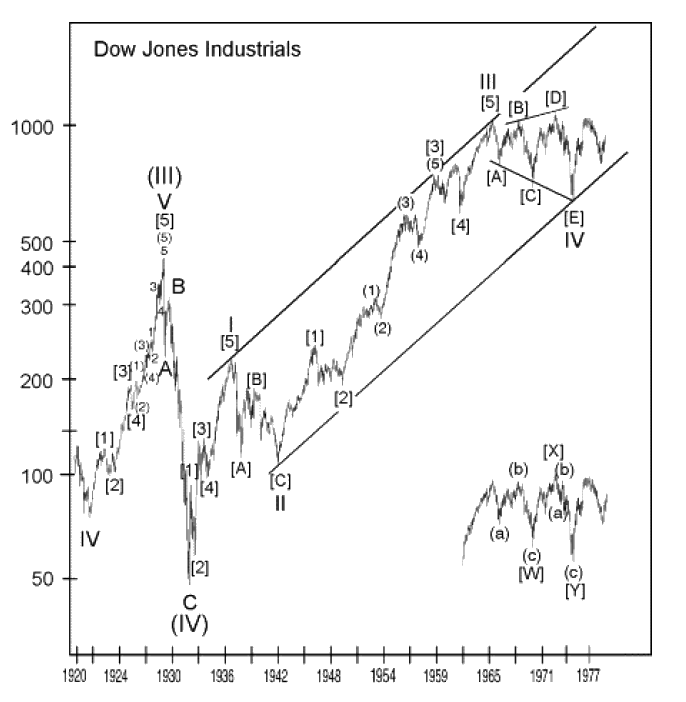
Figure 5-3
Wave V: 1974 to ? — This wave of Cycle degree is still unfolding. It is likely that two Primary waves have been completed at this juncture and that the market is in the process of tracing out the third Primary, which should accompany a breakout to new all time highs. The last chapter will cover in somewhat more detail our analysis and expectations with respect to the current market.
Thus, as we read Elliott, the current bull market in stocks is the fifth wave from 1932 of the fifth wave from 1789 within an extended third wave from the Dark Ages. Figure 5-4 gives the composite picture and speaks for itself.
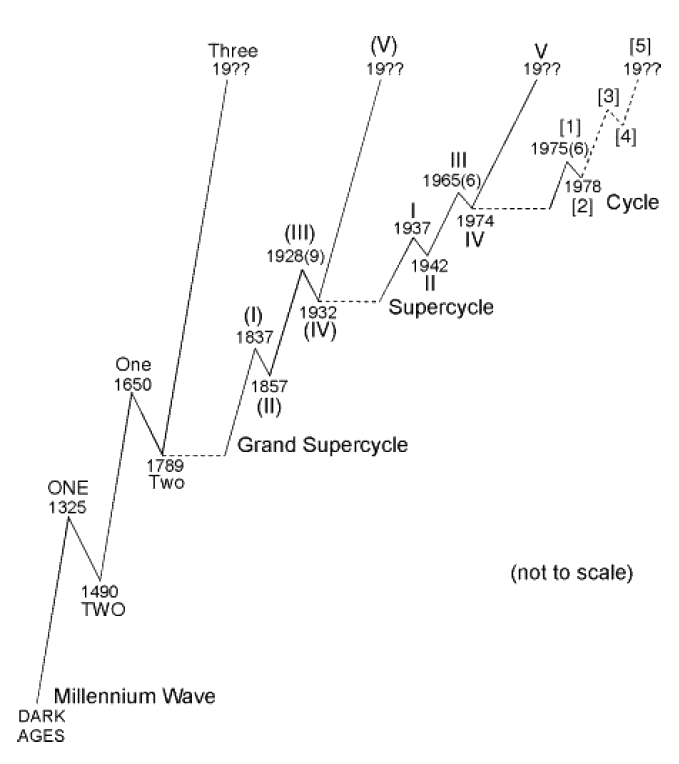
Figure 5-4
The history of the West from the Dark Ages appears in retrospect to have been an almost uninterrupted phase of human progress. The cultural rise of Europe and North America, and before that the rise of the Greek city-states and the expansion of the Roman Empire, and before that the thousand year wave of social progress in Egypt, might be termed waves of Cultural degree, each of which was separated by Cultural degree waves of stagnation and regress, each lasting centuries. One might argue that even these five waves, constituting the entirety of recorded history to date, may constitute a developing wave of Epochal degree, and that some period of social catastrophe centuries hence (involving nuclear war, perhaps?) will ultimately ensure the occurrence of the largest human social regress in five thousand years.
Of course, the theory of the spiraling Wave Principle suggests that there exist waves of larger degree than Epochal. The ages in the development of the species Homo sapiens might be waves of even higher degree. Perhaps Homo sapiens himself is one stage in the development of hominids, which in turn are one stage in the development of even larger waves in the progress of life on Earth. After all, if the existence of the planet Earth is conceived to have lasted one year so far, life forms emerged from the oceans five weeks ago, while manlike creatures have walked the Earth for only the last six hours of the year, less than one one-hundredth of the total period during which forms of life have existed. On this basis, Rome dominated the Western world for a total of five seconds. Viewed from this perspective, a Grand Supercycle degree wave is not really of such large degree after all.