More Guidelines
Scale
The larger the degree, the more necessary a semilog scale usually becomes. On the other hand, the virtually perfect channels that were formed by the 1921-1929 market on semilog scale (see Figure 2- 11) and the 1932-1937 market on arithmetic scale (see Figure 2-12) indicate that waves of the same degree will form the correct Elliott trend channel only when plotted selectively on the appropriate scale. On arithmetic scale, the 1920s bull market accelerates beyond the upper boundary, while on semilog scale the 1930s bull market falls far short of the upper boundary. Aside from this difference in channeling, these two waves of Cycle dimension are surprisingly similar: they create nearly the same multiples in price (six times and five times respectively), they both contain extended fifth waves, and the peak of the third wave is the same percentage gain above the bottom in each case. The essential difference between the two bull markets is the shape and time length of each individual subwave.
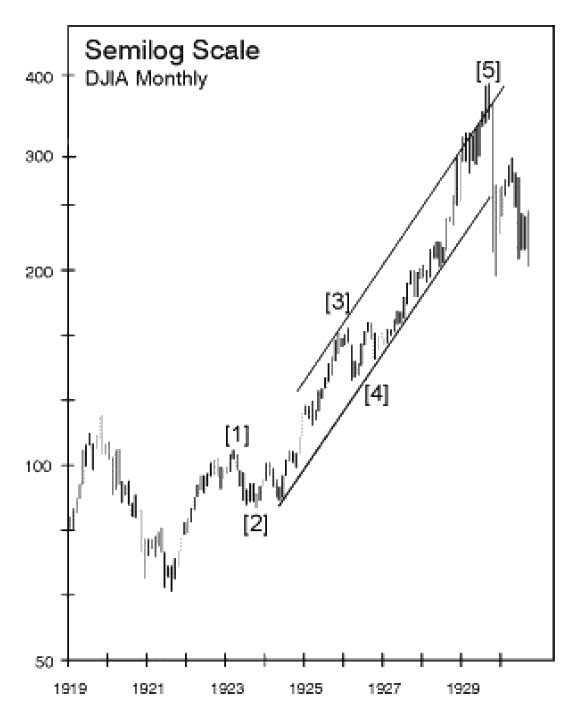
Figure 2-11
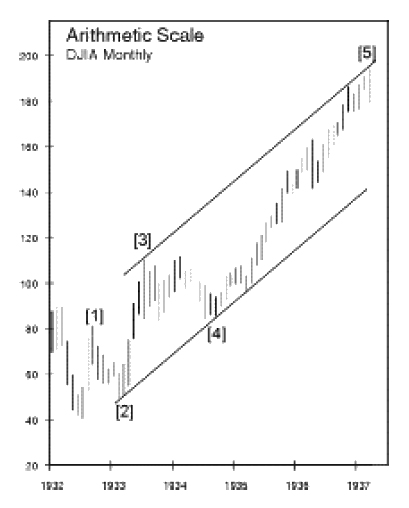
Figure 2-12
At most, we can state that the necessity for semilog scale indicates a wave that is in the process of acceleration, for whatever mass psychological reasons. Given a single price objective and a specific length of time allotted, anyone can draw a satisfactory hypothetical Elliott Wave channel from the same point of origin on both arithmetic and semilog scale by adjusting the slope of the waves to fit. Thus, the question of whether to expect a parallel channel on arithmetic or semilog scale is still unresolved as far as developing a definite tenet on the subject. If the price development at any point does not fall neatly within two parallel lines on the scale (either arithmetic or semilog) you are using, switch to the other scale in order to observe the channel in correct perspective. To stay on top of all developments, the analyst should always use both.
Volume
Elliott used volume as a tool for verifying wave counts and in projecting extensions. He recognized that in any bull market, volume has a natural tendency to expand and contract with the speed of price change. Late in a corrective phase, a decline in volume often indicates a decline in selling pressure. A low point in volume often coincides with a turning point in the market. In normal fifth waves below Primary degree, volume tends to be less than in third waves. If volume in an advancing fifth wave of less than Primary degree is equal to or greater than that in the third wave, an extension of the fifth is in force. While this outcome is often to be expected anyway if the first and third waves are about equal in length, it is an excellent warning of those rare times when both a third and a fifth wave are extended.
At Primary degree and greater, volume tends to be higher in an advancing fifth wave merely because of the natural long term growth in the number of participants in bull markets. Elliott noted, in fact, that volume at the terminal point of a bull market above Primary degree tends to run at an all-time high. Finally, as discussed earlier, volume often spikes briefly at points of throw-over at the peak of fifth waves, whether at a trend channel line or the terminus of a diagonal triangle. (Upon occasion, such points can occur simultaneously, as when a diagonal triangle fifth wave terminates right at the upper parallel of the channel containing the price action of one larger degree.) In addition to these few valuable observations, we have expanded upon the importance of volume in various sections of this course.
The "Right Look"
The overall appearance of a wave must conform to the appropriate illustration. Although any five-wave sequence can be forced into a three-wave count by labeling the first three subdivisions as one wave "A" as shown in Figure 2-13, it is incorrect to do so. The Elliott system would break down if such contortions were allowed. A long wave three with the end of wave four terminating well above the top of wave one must be classified as a five-wave sequence. Since wave A in this hypothetical case is composed of three waves, wave B would be expected to drop to about the start of wave A, as in a flat correction, which it clearly does not. While the internal count of a wave is a guide to its classification, the right overall shape is, in turn, often a guide to its correct internal count.
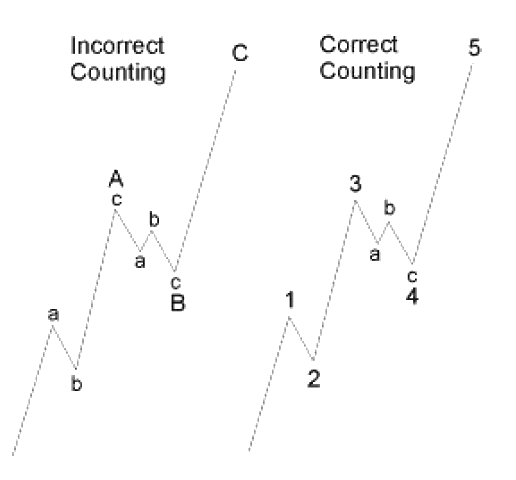
Figure 2-13
The "right look" of a wave is dictated by all the considerations we have outlined so far in the first two chapters. In our experience, we have found it extremely dangerous to allow our emotional involvement with the market to let us accept wave counts that reflect disproportionate wave relationships or misshapen patterns merely on the basis that the Wave Principle's patterns are somewhat elastic.